
[SCIENCE] (Royal Society)
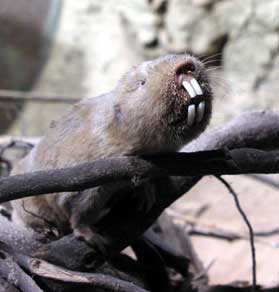
Les rongeurs (Taupes de Ansell) se dirigent dans leur terrier souterrain, selon leur position satellitaire
Une bien curieuse neuro-fonction biologique du cerveau des rongeurs, vue la théorie "Hasardoïde" de l'évolutionnisme
Les créationnistes "sourient" ...
Les créationnistes "sourient" ...
Première partie : résumé de l'article de la Royal Society (10 mars 2010)
(en français)
Résumé
Le substrat neuronal subserving magnetoreception et l'orientation magnétique chez les mammifères est largement inconnue. Des expériences antérieures ont démontré que le traitement des informations sensorielles magnétiques prend place dans le colliculus supérieur. Ici, les effets des conditions du champ magnétique sur l'activité neuronale chez le rongeur de navigation du circuit ont été évalués par la quantification de l'expression de c-Fos. Ansell rats-taupes (Fukomys anselli), un modèle de mammifères pour l'étude des mécanismes d'orientation compas magnétique, ont été soumis à naturel, changeant périodiquement, et à l'abri des champs magnétiques, tout en explorant une arène inconnue circulaire. Dans le champ géomagnétique intactes locales, l'exploration de l'environnement roman et / ou le comportement de nidification induit l'expression de c-Fos dans tout le système direction de la tête et le système entorhinal-hippocampique représentation spatiale. Cette induction a été supprimé de manière significative par l'exposition à modifier périodiquement et / ou blindés champs magnétiques; diminue discrets dans c-Fos ont été observés dans le noyau dorsal tegmentale, le anterodorsal et les noyaux thalamiques laterodorsal, le postsubiculum, le cortex entorhinal et rétrosplénial, et le hippocampe. Par ailleurs, chez les animaux inactifs, la manipulation d'intensité du champ magnétique de supprimer l'expression de c-Fos dans les champs CA1 et CA3 de l'hippocampe et le subiculum dorsal, mais l'expression induite dans la couche polymorphe du gyrus denté. Ces résultats suggèrent que constituants principaux du circuit de la navigation rongeurs contiennent des populations de neurones sensibles aux stimuli magnétiques. Ainsi, l'information magnétique peut être intégrée avec les informations sensorielles et motrices multimodales en une représentation spatiale de l'espace commun au sein allocentrique ce circuit.
compas magnétique
hippocampe
cortex entorhinal
cellules de lieu
Les cellules de grille
cellules direction de la tête
Taupe de Ansell (espèce endémique de Zambie, sud-est de l'Afrique)
Deuxième partie : l'article complet en anglais (9 shémas et coupes biologiques)
Disponible sur :
http://rsif.royalsocietypublishing.org/content/early/2010/03/10/rsif.2009.0551
Changing and shielded magnetic fields suppress c-Fos expression in the navigation circuit: input from the magnetosensory system contributes to the internal representation of space in a subterranean rodent
- Tomáš Burger1,†,
- Marcela Lucová1,
- Regina E. Moritz2,
- Helmut H. A. Oelschläger3,
- Rastislav Druga4,
- Hynek Burda2,
- Wolfgang Wiltschko5,
- Roswitha Wiltschko5 and
- Pavel Němec1,3,*†
- 1Department of Zoology, Faculty of Science Charles University in Prague, Vinicna 7, CZ-12844 Praha 2, Czech Republic
- 4Anatomical Institute, 2nd and 1st Medical Faculty, Charles University in Prague, Vinicna 7, CZ-12844 Praha 2, Czech Republic
- 2Department of General Zoology, University of Duisburg-Essen, Essen, Germany
- 3Institute of Anatomy III (Dr. Senckenbergische Anatomie), Johann Wolfgang Goethe University, Frankfurt am Main, Germany
- 5Department of Zoology, Johann Wolfgang Goethe University, Frankfurt am Main, Germany
- *Author for correspondence (pgnemec@natur.cuni.cz).
Abstract
The neural substrate subserving magnetoreception and magnetic orientation in mammals is largely unknown. Previous experiments have demonstrated that the processing of magnetic sensory information takes place in the superior colliculus. Here, the effects of magnetic field conditions on neuronal activity in the rodent navigation circuit were assessed by quantifying c-Fos expression. Ansell's mole-rats (Fukomys anselli), a mammalian model to study the mechanisms of magnetic compass orientation, were subjected to natural, periodically changing, and shielded magnetic fields while exploring an unfamiliar circular arena. In the undisturbed local geomagnetic field, the exploration of the novel environment and/or nesting behaviour induced c-Fos expression throughout the head direction system and the entorhinal-hippocampal spatial representation system. This induction was significantly suppressed by exposure to periodically changing and/or shielded magnetic fields; discrete decreases in c-Fos were seen in the dorsal tegmental nucleus, the anterodorsal and the laterodorsal thalamic nuclei, the postsubiculum, the retrosplenial and entorhinal cortices, and the hippocampus. Moreover, in inactive animals, magnetic field intensity manipulation suppressed c-Fos expression in the CA1 and CA3 fields of the hippocampus and the dorsal subiculum, but induced expression in the polymorph layer of the dentate gyrus. These findings suggest that key constituents of the rodent navigation circuit contain populations of neurons responsive to magnetic stimuli. Thus, magnetic information may be integrated with multimodal sensory and motor information into a common spatial representation of allocentric space within this circuit.Previous SectionNext Section
1. Introduction
Magnetoreception is a widespread but poorly understood sensory ability. Despite remarkable progress accomplished during the past decade, the transduction mechanisms and the neural basis of magnetoreception and magnetic orientation remain largely unclear (for review, see Johnsen & Lohmann 2005, 2008; Mouritsen & Ritz 2005; Wiltschko, W. & Wiltschko, R. 2005; Wiltschko, R. & Witschko, W. 2006; Rodgers & Hore 2009). Recent research into magnetoreception mechanisms mainly focused on the localization of magnetoreceptors and elucidating the biophysical and molecular basis of the primary detection events. The central processing of the magnetic information has received only scant attention (for review of the neurobiological evidence, see Cain et al. 2005; Němec et al. 2005; Frost & Mouritsen 2006; Mehlhorn & Rehkämper, 2009). In birds, early electrophysiological (Semm et al. 1984; Semm & Demaine 1986) and 14C-2-deoxyglucose mapping (Mai & Semm 1990) studies provided evidence for the involvement of the tectofugal and accessory optic visual systems. Recent studies using inducible transcription factors as markers of neuronal activation suggested the implication of the thalamofugal visual system (Mouritsen et al. 2005; Heyers et al. 2007; Liedvogel et al. 2007) and the hippocampus (Shimizu et al. 2004; P. Němec, M. Lucová & H. H. A. Oelschläger 2004, unpublished data). The former finding has recently been confirmed by lesion experiments (Zapka et al. 2009), the latter electrophysiologically (Vargas et al. 2006). In mammals, a single study has demonstrated processing of magnetic information in the superior colliculus (Němec et al. 2001).Neural mechanisms and substrates of near space navigation are well known in rodents (for review, see Best et al. 2001; Etienne & Jeffery 2004; Taube 2007; Moser et al. 2008; for a comprehensive review see also Sharp 2002; Jeffery 2003; Wiener & Taube 2005). The understanding of how both space and the animal's position within that space are represented in the brain has been revolutionized by the discoveries of three principal neuronal types: the place cells (O'Keefe & Dostrovsky 1971; O'Keefe 1976), the head direction cells (Ranck 1984; Taube et al. 1990) and the grid cells (Fyhn et al. 2004; Hafting et al. 2005). The place cells exhibit location-specific activity and their entire population likely generates an abstract map-like representation of the animal's spatial surroundings (O'Keefe & Nadel 1978). The head direction cells exhibit direction-specific activity and their entire population encodes the animal's directional heading (Taube 2007). Finally, the grid cells discharge at multiple locations forming a regular triangular array, or grid, across the entire environment explored by the animal. These grid maps are likely to be important for determining distance and tracking the animal's route over time (trajectory encoding; Moser et al. 2008). Complex synergy of these key computational units is required for successful spatial navigation (e.g. Sharp et al. 2001; McNaughton et al. 2006; Samu et al. 2009). Brain regions harbouring the place, grid and head direction cells constitute the core of a spatial representation system, which will be referred to as the rodent navigation circuit (figure 1). It is to be noted that several key constituent regions of this circuit, including the hippocampus, anterior thalamic nuclei, mammillary bodies and retrosplenial cortex, also play a pivotal role in spatial and contextual learning and memory (Aggleton & Pearce 2001). Most importantly, besides encoding the animal's position, the hippocampal place cells (pyramidal neurons) are involved in the forming and consolidation of context-specific episodic memory (Wood et al. 2000; Ferbinteanu & Shapiro 2003; Moita et al. 2003; Leutgeb et al. 2005).
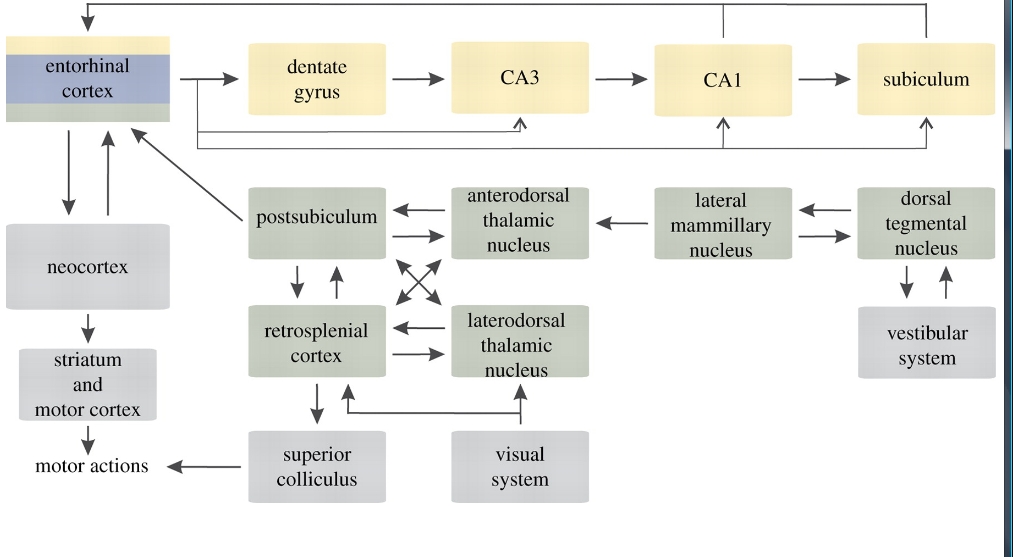
View larger version: Figure 1. A simplified diagram showing anatomy of the rodent navigation circuit. Brain areas containing the place cells, the head direction cells and the grid cells are shown in yellow, green and blue, respectively. Note that the entorhinal cortex harbours all three neuronal types. The main inputs and outputs of the navigation circuit are shown in grey. Modified from Touretzky (2002) and Taube (2007). See Witter & Amaral (2004) and Taube (2007) for a comprehensive review of the circuit connections.
All the aforementioned computational elements are multimodal, their activity being driven by both allothetic, i.e. visual and non-visual landmarks, and idiothetic cues, i.e. internal movement cues based on proprioceptive and vestibular information from sensory flow, or efferent copies of movement commands (for review, see Knierim 2002; Muller et al. 2002; Taube 2002; Moser et al. 2008). Visual landmarks and geometric boundaries of the local environment play a primary role in defining the spatial discharge patterns of the place cells (Muller et al. 2002) and grid cells (Hafting et al. 2005; Barry et al. 2007). Likewise, the preferred firing direction of the head direction cells is efficiently controlled by visual landmarks (Taube 2002). Olfactory cues may exert control over the head direction cells in the absence of visual landmarks (Goodridge et al. 1998). So far and to the best of our knowledge, no evidence exists that any part of the above described neuronal machinery is sensitive to the Earth's magnetic field. Indeed, physiological studies have gathered abundant evidence that the preferred firing direction of the head direction cells is not anchored to the ambient magnetic field (Blair & Sharp 2002; Taube 2002). However, almost all the research was done in the laboratory rat, which preferentially uses visual, olfactory and self-movement cues for spatial guidance (Maaswinkel & Whishaw 1999). Generalizations from the well-studied rat model should be made with great caution, since cues used to solve the navigation tasks can differ dramatically among species adapted to different habitats and lifestyles.
Strictly subterranean, congenitally microphthalmic mole-rats represent an extreme case of sensory adaptation. On the one hand, they possess a severely reduced visual system, which renders their visually guided navigation ineffective if not impossible (for review, see Němec et al. 2007, 2008). On the other hand, they have extraordinary tactile (for review, see Kimchi & Terkel 2004; Park et al. 2007) and magnetosensory capacities (for review, see Moritz et al. 2007). Indeed, it has been repeatedly shown that these animals use directional cues from the ambient magnetic field as an external directional reference both for magnetic compass orientation in a circular arena or a radial maze (Burda et al. 1990, 1991; Marhold et al. 1997a,b, 2000; Kimchi & Terkel 2001) and for path integration (Kimchi et al. 2004). Ansell's mole-rat (Fukomys anselli), a mammalian model to study the mechanisms of magnetic compass orientation (Marhold et al. 1997a; Němec et al. 2001; Thalau et al. 2006; Wegner et al. 2006), exhibits a spontaneous drive to build nests in the southeastern sector of a circular arena using magnetic field azimuth as the primary orientation cue (Burda et al. 1990; Marhold et al. 1997b). Thus, it seems likely that magnetic information is integrated with multimodal sensory and motor information within the spatial representation system in this species. We therefore investigated whether neuronal activity in the navigation circuit of Ansell's mole-rats is affected by the exposure to altered magnetic fields using the detection of c-Fos expression as a concomitant marker of neuronal responsiveness. This firmly established method has been successfully applied to study the neural correlates of various complex processes including magnetic compass orientation and spatial learning and memory (for review of the original literature and methodological aspects, see Herdegen & Leah 1998; Colombo 2004; Němec et al. 2005; Kubik et al. 2007; Miyashita et al. 2008). We tested our subjects in natural, periodically changing and shielded magnetic fields in two environments: a familiar cage (already established representation of the local space) and an unfamiliar circular arena (the phase of forming a representation of the space that the animals are exploring).
Previous SectionNext Section
2. Material and methods
2.1. Animals and animal husbandry
Twenty-two adult Ansell's mole-rats (F. anselli, Bathyergidae, Rodentia) of both sexes were used in this study. The animals either originated from the breeding colony of the University of Duisburg-Essen or were wild-caught adults imported from Zambia (owing to the extremely low reproductive rate of these eusocial rodents, we could not get sufficient numbers of captivity-reared individuals); all animals spent at least 1 year in captivity. They were fully grown adults (body weight, 70-120 g) that showed no signs of senescence. Although the life expectancy of individuals could not be reliably assessed at the time of the experiment, it is to be noted that Ansell's mole-rats are known for their remarkable longevity (mean survival approx. 10 and 5 years for breeders and non-breeders, respectively; Dammann & Burda 2006). They were reared and/or kept in family groups and provided with food ad libitum. A few weeks before the experiments, the experimental animals were transported to the Zoological Institute in Frankfurt am Main to accustom them to the new housing conditions. Animals were kept under a 12 : 12 h light/dark (LD) cycle (6.00-18.00 h light) throughout the habituation period and experiments. It is to be noted in this context that Ansell's mole-rat exhibits only weak circadian rhythms and large variations in activity patterns occur among individuals (de Vries et al. 2008). Typically, about 60 per cent of the locomotor activity occurs during the dark phase of the LD cycle. Thus, activity is not restricted to the dark phase. Efforts were made to minimize the number of animals used and their distress.2.2. Behavioural procedures and magnetic exposure conditions
Experiments were conducted in Frankfurt am Main (50°08′ N, 08°40′ E) and took place in wooden huts in the garden of the Zoological Institute between 09.00 and 11.00 h Central European Time. Lighting was provided by an incandescent light bulb centred above the testing arena/cage. A light intensity of 40 mW m-2 was obtained by varying the distance of the bulb from the arena/cage (measured with a P9710 photometer fitted with a SN1055 probe, Gigahertz-Optik GmbH, Puchheim, Germany). All experiments were performed on freely moving animals that had been kept in sibling pairs/groups to avoid social stress. Each experimental trial was continuously observed in real time by a B/W video camera (top view) connected to a surveillance monitor and, in parallel, recorded to videotape.The local geomagnetic field (46 µT, 66° inclination) was undisturbed in the test huts. Changing magnetic fields were produced by adding periodically an artificial field to the ambient magnetic field. The artificial fields were generated by a pair of circular Helmholtz coils wrapped on a wooden frame with a diameter of either 1.7 m (experiment 1) or 2 m (experiment 2). For the manipulation of the field polarity and azimuth, the coil axis was aligned with the field horizontal intensity vector and 150° anticlockwise to the field horizontal intensity vector, respectively. The shifted fields with the magnetic north at the geographical south (mN = 180°) or west-southwest (mN = 240°) closely resembled the local geomagnetic field in the inclination (±<1%) and total intensity (±<1%). To reduce the electromotive force induced in tissues owing to a changing magnetic field, the currents supplied to the coils were changed gradually in 250 steps over a period of 0.7 s. For the manipulation of the field intensity, the coil axis was tilted by 24° from the vertical to ensure that the applied field was collinear with the total intensity vector of the ambient field. Thus, only the total intensity of the field was affected, the north direction and the inclination remained unchanged. The coils were powered by a custom, microprocessor-driven power supply (Hamann Hardware & Software Development, Plön, Germany). The ambient magnetic field was shielded by placing the testing arena in a µ-metal chamber attenuating the ambient field intensity approximately 150 times to approximately 0.3 µT. Earlier experiments have demonstrated that mole-rats are unable to orient under these conditions (Marhold et al. 1997a).
Magnetic fields were measured using a single-axis fluxgate magnetometer Mag-01 (Bartington Instruments Ltd, Oxford, UK) and/or a three-axis digital magnetometer GeoMag fitted with a Honeywell HMR2300 probe sensor (Edis vvd, Kosice, Slovakia) after each experiment.
2.2.1. Experiment 1
Ten animals, in sibling pairs or in groups of three siblings, were exposed to magnetic fields for 1 h while largely inactive within familiar cages. Five days before the experiment, mole-rats had been taken from the breeding colony and transported to the behavioural testing facility. The animals were habituated to transparent polyethylene cages (32 × 17 × 19 cm) inside the test huts. A thin layer of horticultural peat and tissue papers was provided as litter and nest material, respectively. Food was provided ad libitum during the habituation period. Mole-rats typically built nests on one side of the cage and food caches on the other. About 24 h before the experiment, the cages were cleaned, provided with fresh food, litter and nest material and placed in the centre of the Helmholtz coils.Animals were assigned randomly to one of three treatment groups and exposed to the following magnetic conditions: (i) the local geomagnetic field (mN = 360°, intensity = 46 µT, inclination = +66°; four animals); (ii) the experimental magnetic field, the horizontal component of which was inverted every 30 s (mN shifted from 360° to 180° and back, intensity = 46 µT, inclination = +66°; three animals); and (iii) the experimental magnetic field, the intensity of which was changed by 1 µT every 2 s (mN = 360°, intensity changed from 46 to 47 µT and back, inclination = +66°; three animals).
2.2.2. Experiment 2
Twelve animals, in sibling pairs, were exposed to magnetic fields during exploring and nest building in an unfamiliar arena. At least 2 h before the respective experiment, each individual pair was brought to the testing hut and kept in a light-tight plastic bucket outside the testing arena in the undisturbed local geomagnetic field. To begin each experiment, the two animals were released in a circular plastic arena (82 cm diameter and 30 cm high, made of vinidur impervious to light) placed either in the centre of the pair of Helmholtz coils or in the µ-metal chamber. The arena was filled with a thin layer of horticultural peat as litter, scattered slips of tissue papers as nest material and randomly distributed pieces of carrots as food. Animals were allowed to explore the novel environment and build their nest and food caches for 1 h.Experiments were performed under the following magnetic conditions: (i) the local geomagnetic field (mN = 360°, intensity = 46 µT, inclination = +66°; four animals), (ii) the experimental magnetic field that was shifted in azimuth by 120° (mN shifted from 360° to 240° and back, intensity = 46 µT, inclination = +66°) either every 5 min (i.e. 5 min of the ambient field followed by 5 min of the shifted field, etc.; four animals) or every second (two animals), and (iii) the shielded magnetic field (intensity approx. 0.3 µT; two animals). Exposure order was randomized between experiments.
Between trials, the peat litter, tissue papers and food pieces were removed from the arena and discarded, and the arena was thoroughly cleaned with 70 per cent ethanol.
2.3. Tissue processing and immunocytochemistry
Immediately after the behavioural experiments, mole-rats were overdosed with halothane and perfused transcardially with heparinized saline followed by fixative (4% paraformaldehyde in 0.1 M phosphate buffer (PB), pH 7.4). The brains were dissected, post-fixed overnight in the same fixative, and cryoprotected in sucrose buffer (30% sucrose in PB). Following sucrose-gelatin embedding of the specimens (30% sucrose, 10% gelatin in distilled water), the gelatin blocks were fixed in sucrose-paraformaldehyde solution (30% sucrose, 4% paraformaldehyde in PB). The left upper margin of the gelatin block was trimmed to mark the left side of the brain. The brains were sectioned on a cryotome (MICROM HM 350, Heidelberg, Germany) in the coronal plane at a thickness of 60 µm.The details of the immunocytochemical protocol were published previously (Oelschläger et al. 2000; Němec et al. 2001). Briefly, the free-floating sections were incubated in 0.3 per cent hydrogen peroxide solution for 30 min, rinsed in phosphate-buffered saline (0.9% NaCl in PB) and then incubated for 12 h at room temperature with a rabbit polyclonal antibody raised against a synthetic peptide corresponding to amino acids 4-17 of human c-Fos (Oncogene Research, Calbiochem, Cambridge, MA, USA; catalogue no. PC38). This antibody recognizes c-Fos and its viral homologue v-Fos and shows no cross-reactions with other members of the Fos protein family. The primary antibody was detected using biotinylated anti-rabbit goat serum and an avidin-biotin-peroxidase complex (Vectastain Elite ABC-Kit, Vector Laboratories Inc., Burlingame, CA, USA). The peroxidase reaction was developed in PB solution containing diaminobenzidine tetrahydrochloride (0.05%), nickel ammonium sulphate (0.01%), cobalt chloride (0.0125%) and hydrogen peroxide (0.02%). After the diaminobenzidine reaction, sections were rinsed four times in PB, mounted on gelatin-coated slides, dried overnight and coverslipped with Eukitt. Control sections were incubated with normal rabbit serum or with the primary antibody pre-absorbed with 0.1 µg ml-1 of synthetic c-Fos peptide, both of which prevented all nuclear staining. Every fourth section was counterstained with cresyl violet and used for general orientation.
2.4. Data analysis
For quantitative analysis, animals were given codes not related to the experimental conditions and all counts were done by an observer (T.B.) blind to these codes. The numbers of c-Fos-immunoreactive (IR) neurons were quantified in 18 regions (figure 2). Fifteen of them were constituent structures of the rodent navigation circuit. The remaining three regions-the striatum, the primary motor and primary somatosensory cortices-were included in the analysis as control sites, which are not directly involved in spatial navigation and memory and where no c-Fos differences should occur between experimental groups if the groups are matched for a total locomotor activity and somatosensory demands. At 100× magnification, c-Fos-IR nuclei were counted bilaterally using the Olympus analysis software (Olympus Europe GMBH, Hamburg, Germany) in three to six consecutive sections depending on the size of the brain structure of interest. Section planes were standardized according to the rat and the naked mole-rat stereotaxic atlases (Paxinos & Watson 2005; Xiao et al. 2006). In large structures, c-Fos-IR nuclei were counted in a standard-size frame of 0.5 mm2 (CPu, M1, MEnt, LEnt, RSD, RSG, S1) or 0.25 mm2 (DS, Post, PRh, VS). Counts were taken across all layers of all cortical regions. In small subcortical nuclei and the polymorph layer of the dentate gyrus (PoDG), counts were done within the border of a particular nucleus or layer and subsequently standardized to an area of 0.1 mm2 (AD, DTg, LD, LM) or 0.25 mm2 (PoDG). Finally, in the granular layer of the dentate gyrus and fields CA1 and CA3 of the hippocampus, counts were standardized to 1 mm of the granular layer and the pyramidal cell layer, respectively. For each structure, counts were averaged over representative sections, the two sides of the brain and across animals within the different experimental groups; the data are presented as means ± s.e.m. Comparisons between groups were analysed statistically using one-way analysis of variance (ANOVA) followed by Tukey post hoc tests. A 95% confidence level (p < 0.05) was used to judge statistical significance. All statistics were performed using Statistica for Windows (StatSoft, Inc., Tulsa, OK, USA).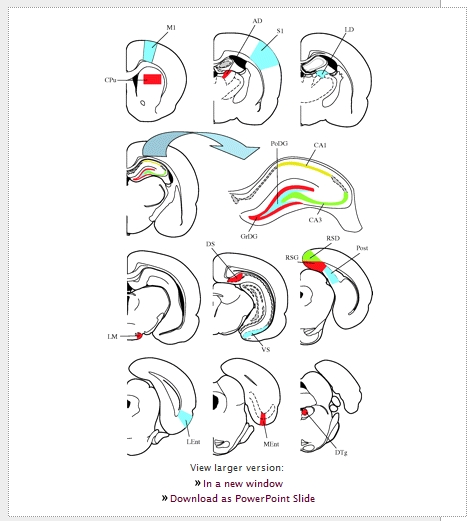
View larger version: Figure 2. Diagrams of coronal sections showing the location of the 18 brain regions investigated. Schemes adapted from Paxinos & Watson (2005). AD, anterodorsal thalamic nucleus; CA1, field CA1 of the hippocampus; CA3, field CA3 of the hippocampus; CPu, caudate putamen (striatum); DS, dorsal subiculum; DTg, dorsal tegmental nucleus; GrDG, granular layer of the dentate gyrus; LD, laterodorsal thalamic nucleus; LEnt, lateral entorhinal cortex; LM, lateral mammillary nucleus; M1, primary motor cortex; MEnt, medial entorhinal cortex; PoDG, polymorph layer of the dentate gyrus; Post, postsubiculum; RSD, retrosplenial dysgranular cortex; RSG, retrosplenial granular cortex; S1, primary somatosensory cortex; VS, ventral subiculum.
Note that in one of the animals exploring the arena in the shielded magnetic field, c-Fos-IR cells could not be reliably counted in the medial and lateral entorhinal cortices and the ventral subiculum owing to staining artefacts that had occurred in the ventrocaudal telencephalon. Consequently, only one independent datum point was available for the mentioned structures and magnetic conditions. In these cases, we have excluded the experimental group from the statistical analysis.
Previous SectionNext Section
3. Results
3.1. Behaviour and general pattern of c-Fos expression
Mole-rats were largely inactive when confined to small, familiar cages. They spent most of the time resting in the nest and were only sporadically engaged in foraging. On the contrary, animals released to the arena actively explored the novel environment and exhibited a typical nesting behaviour (Burda et al. 1990; Marhold et al. 1997a,b): retrieval of available scattered nesting materials or food items and building a nest and food caches. This behaviour seemed not to be attenuated by exposure to the altered magnetic field conditions. Likewise, with a single exception, we did not notice an overt behavioural reaction to the field changes. Animals exposed to the field that was shifted in azimuth by 120° every second while nesting in the arena exhibited frequent nose-to-wall contacts. These contacts were particularly pronounced towards the end of the experiment, possibly reflecting discomfort and/or escape reactions. Alternatively, the nose-to-wall contacts in animals exposed to magnetic field shifts may reflect recalibrations of their navigation system using tactile information in response to perceived magnetic field instability.Sparse to moderate c-Fos immunoreactivity was found throughout the brains of the caged mole-rats. This finding concurs with the quiescent state of these animals prior to perfusion. Generally, a higher density of IR cells was observed throughout the brains of mole-rats nesting in the arena. Marked differences in c-Fos expression between the two groups were found within both navigation and motor circuits (figures 3-9). Figures 3, 5, 6, 8 and 9 show the mean numbers of c-Fos-IR cells for the 15 regions that constitute the navigation circuit and three control regions that are nodal points of the motor circuit, respectively. When control animals exposed to the local geomagnetic field were compared, mole-rats nesting in the arena showed higher c-Fos expression relative to the caged animals in 11 out of 15 constituent structures of the navigation circuit (figures 3, 5, 6 and 8; table 1) and in two out of three control regions related to sensorimotor functions (figure 9; table 1).
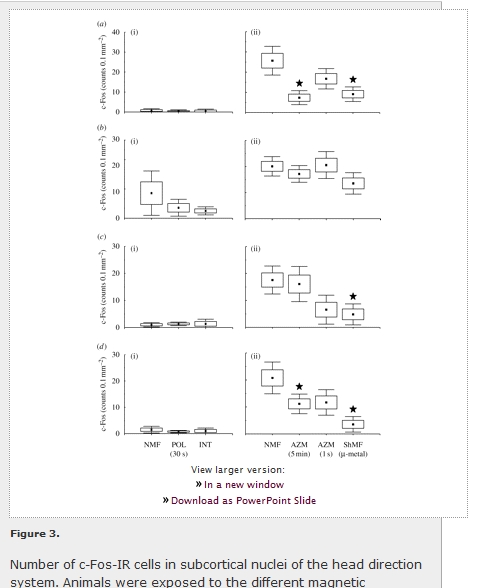
View larger version: Figure 3. Number of c-Fos-IR cells in subcortical nuclei of the head direction system. Animals were exposed to the different magnetic conditions while largely inactive within their home cages (a-d (i)) or while nesting in an unfamiliar circular arena (a-d (ii)). Boxes and whiskers denote the s.e.m. and 0.95% confidence intervals, respectively. Significant differences are indicated by asterisks (Tukey post hoc test; p < 0.05). Closed asterisks indicate comparison with a control group of animals exposed to the local geomagnetic field. AZM (5 min) and AZM (1 s), experimental magnetic fields that were shifted in azimuth by 120° every 5 min or every second; INT, experimental magnetic field, the intensity of which was changed by 1 μT every 2 s; NMF, natural geomagnetic field; POL (30 s), experimental magnetic field, the horizontal polarity of which was inverted every 30 s; ShMF (µ-metal), shielded magnetic field. (a) Dorsal tegmental nucleus (DTg); (b) lateral mammillary nucleus (LM); (c) anterodorsal thalamic nucleus (AD); (d) laterodorsal thalamic nucleus (LD).
View this table:
Table 1.
ANOVA of c-Fos counts.
| home cage versus arena natural geomagnetic field | effect of magnetic field conditions in home cage | effect of magnetic field conditions in arena | ||||
|---|---|---|---|---|---|---|
| brain region | F1,6 | p-value | F2,7 | p-value | F3,8 | p-value |
| head direction system | ||||||
| dorsal tegmental nucleus | 194.415 | 3.41 × 10⁻⁵ | 0.124 | 0.886 | 7.786 | 0.017 |
| lateral mammillary nucleus | 2.682 | 0.153 | 2.843 | 0.125 | 2.016 | 0.190 |
| anterodorsal thalamic nucleus | 317.669 | 1.02 × 10⁻⁵ | 0.127 | 0.882 | 4.150 | 0.048 |
| laterodorsal thalamic nucleus | 17.873 | 0.006 | 0.598 | 0.573 | 5.519 | 0.023 |
| postsubiculum | 19.193 | 0.005 | 0.274 | 0.769 | 8.669 | 0.007 |
| retrosplenial granular cortex | 166.803 | 1.33 × 10⁻⁵ | 0.465 | 0.649 | 5.941 | 0.020 |
| retrosplenial dysgranular cortex | 11.362 | 0.015 | 0.172 | 0.846 | 1.313 | 0.336 |
| entorhinal–hippocampal system | ||||||
| dentate gyrus, granular layer | 21.273 | 0.004 | 1.316 | 0.327 | 9.585 | 0.005 |
| dentate gyrus, polymorph layer | 64.894 | 1.9 × 10⁻⁴ | 8.523 | 0.013 | 8.597 | 0.007 |
| CA3 | 6.865 | 0.040 | 5.367 | 0.039 | 4.308 | 0.043 |
| CA1 | 1.095 | 0.336 | 7.375 | 0.019 | 9.079 | 0.006 |
| medial entorhinal cortex | 5.981 | 0.050 | 0.726 | 0.517 | 4.898a | 0.047 |
| lateral entorhinal cortex | 32.840 | 0.002 | 0.107 | 0.900 | 4.841a | 0.048 |
| dorsal subiculum | 4.791 | 0.071 | 9.296 | 0.011 | 1.087 | 0.408 |
| ventral subiculum | 1.115 | 0.332 | 0.415 | 0.675 | 2.172a | 0.185 |
| control regions | ||||||
| caudate putamen (striatum) | 28.567 | 0.002 | 0.240 | 0.794 | 0.419 | 0.744 |
| primary motor cortex | 6.809 | 0.040 | 2.126 | 0.190 | 0.451 | 0.723 |
| primary somatosensory cortex | 2.035 | 0.204 | 1.841 | 0.228 | 4.202 | 0.046 |
-
aAnalysis is based on a smaller dataset (F2,7) owing to technical reasons (cf. §2.4).
Table 1. ANOVA of c-Fos counts.
More importantly, the number of IR cells differed significantly between animals subjected to different magnetic conditions. The mean numbers of c-Fos-IR cells and results of the Tukey post hoc test are summarized in figures 3, 5, 6, 8 and 9. The results of the ANOVA are summarized in table 1. In mole-rats nesting in the arena, magnetic field properties significantly affected c-Fos expression in 11 out of 15 constituent structures of the navigation circuit and in the primary somatosensory cortex, but not in the striatum and primary motor cortex that are directly related to motor functions (figures 3, 5, 6, 8 and 9; table 1). Notably, changing and shielded magnetic fields invariably suppressed c-Fos expression within the navigation circuit. Less pronounced magnetic field effects were observed in animals resting in the cages. Changing magnetic fields suppressed expression in three regions and induced expression in one-the PoDG (figures 6 and 8; table 1).
c-Fos immunoreactivity was bilaterally distributed within the navigation circuit. Because of suboptimal quality of the gelatin blocks, the left and the right side could not be distinguished reliably in some brains. Therefore, we were unable to compare statistically the number of c-Fos-IR cells in the two sides of the brain. Nevertheless, no discernible lateralization was observed in the regions analysed.
3.2. c-Fos expression in the head direction system
Subcortical nuclei harbouring the head direction cells displayed low c-Fos expression in the caged animals (figure 3); no magnetic field effect on the expression was observed (figure 3; table 1). In contrast, moderately dense c-Fos immunoreactivity was seen in the arena animals (figures 3 and 4). They exhibited higher c-Fos expression relative to the caged animals in the dorsal tegmental nucleus (F1,6 = 194.4; p < 0.001), anterodorsal thalamic nucleus (F1,6 = 317.7; p < 0.001) and laterodorsal thalamic nucleus (F1,6 = 17.9; p < 0.01). Moreover, a significant effect of the magnetic field properties was detected in the following nuclei: the dorsal tegmental nucleus (F3,8 = 7.8; p < 0.05), anterodorsal thalamic nucleus (F3,8 = 4.1; p < 0.05) and laterodorsal thalamic nucleus (F3,8 = 5.5; p < 0.05). Animals exposed to the fields that were repeatedly shifted in azimuth and/or shielded magnetic fields exhibited significantly suppressed c-Fos expression (figures 3a,c,d and 4). Neither novelty (exploratory) response nor magnetic field effect was detected in the lateral mammillary nucleus (figure 3b; table 1).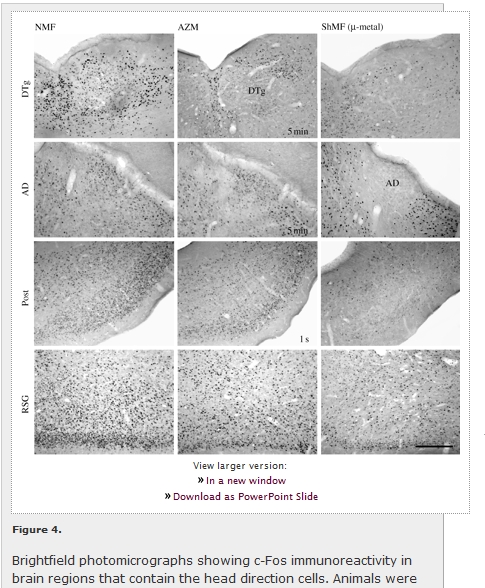
View larger version: Figure 4. Brightfield photomicrographs showing c-Fos immunoreactivity in brain regions that contain the head direction cells. Animals were exposed to the different magnetic conditions while nesting in an unfamiliar circular arena. AD, anterodorsal thalamic nucleus; AZM, experimental magnetic field that was shifted in azimuth by 120° every 5 min or every second (as indicated in the photomicrographs); DTg, dorsal tegmental nucleus; NMF, natural geomagnetic field; Post, postsubiculum; RSG, retrosplenial granular cortex; ShMF (µ-metal), shielded magnetic field. Scale bar, 300 µm.
Likewise, cortical regions containing the head direction cells exhibited a clear increase in the c-Fos immunoreactivity in the animals exploring the arena as opposed to the caged animals (figure 5; table 1). A significant c-Fos induction was detected in all three regions counted: the postsubiculum (F1,6 = 19.2; p < 0.01), retrosplenial granular (F1,6 = 166.8; p < 0.001) and dysgranular (F1,6 = 11.4; p < 0.05) cortices. In the arena animals, a significant effect of the magnetic field conditions was observed in the postsubiculum (F3,8 = 8.7; p < 0.01) and retrosplenial granular cortex (F3,8 = 5.9; p < 0.05). The exposure to the field shifted in azimuth by 120° every second significantly decreased c-Fos expression in the postsubiculum; the exposure to the shielded magnetic field suppressed expression in the postsubiculum and the retrosplenial granular cortex (figures 4 and 5a,b).
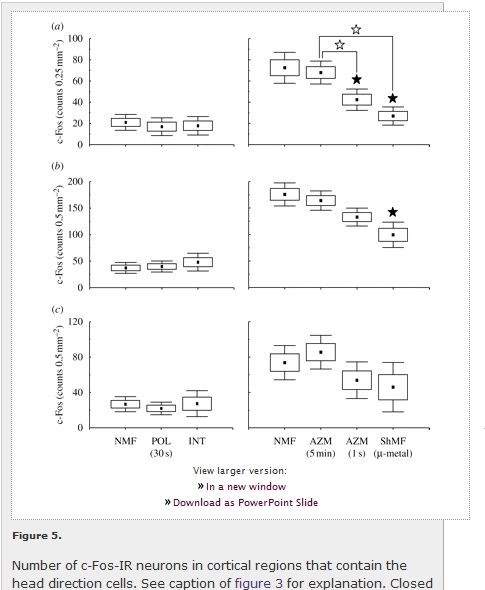
View larger version: Figure 5. Number of c-Fos-IR neurons in cortical regions that contain the head direction cells. See caption of figure 3 for explanation. Closed asterisks indicate comparison with a control group of animals exposed to the local geomagnetic field, open asterisks comparison with another experimental group. (a) Postsubiculum (Post); (b) retrosplenial granular cortex (RSG); (c) retrosplenial dysgranular cortex (RSD).
3.3. c-Fos expression in the entorhinal-hippocampal system
The mole-rats exploring an unfamiliar arena showed elevated c-Fos expression in the granular layer of the dentate gyrus (F1,6 = 21.3; p < 0.01) and PoDG (F1,6 = 64.9; p < 0.001), the CA3 field of the hippocampus (F1,6 = 6.9; p < 0.05), medial (F1,6 = 6.0; p = 0.05) and lateral (F1,6 = 32.8; p < 0.01) entorhinal cortices when compared with the caged animals (figures 68). No differences between the caged and arena animals were detected in the CA1 and subiculum (figures 68; table 1).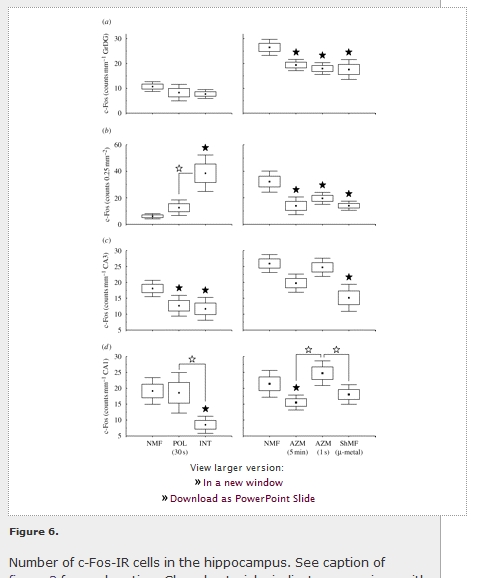
View larger version: Figure 6. Number of c-Fos-IR cells in the hippocampus. See caption of figure 3 for explanation. Closed asterisks indicate comparison with a control group of animals exposed to the local geomagnetic field, open asterisks comparison with another experimental group. (a) Granular layer of the dentate gyrus (GrDG); (b) polymorph layer of the dentate gyrus (PoDG); (c) field CA3 of the hippocampus (CA3); (d) field CA1 of the hippocampus (CA1).
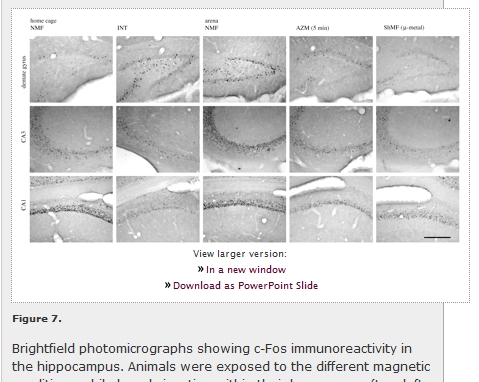
View larger version: Figure 7. Brightfield photomicrographs showing c-Fos immunoreactivity in the hippocampus. Animals were exposed to the different magnetic conditions while largely inactive within their home cages (two left columns) or while nesting in an unfamiliar circular arena (three right columns). AZM (5 min), experimental magnetic field that was shifted in azimuth by 120° every 5 min; CA1, field CA1 of the hippocampus; CA3, field CA3 of the hippocampus; DG, dentate gyrus; INT, experimental magnetic field, the intensity of which was changed by 1 μT every 2 s; NMF, natural geomagnetic field; ShMF (µ-metal), shielded magnetic field. Scale bar, 300 µm.
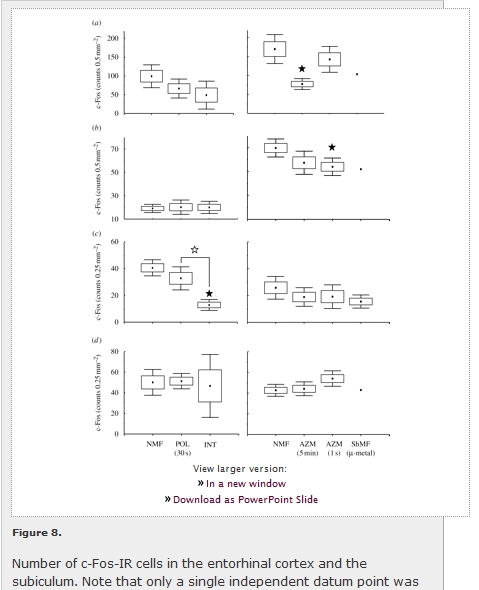
View larger version: Figure 8. Number of c-Fos-IR cells in the entorhinal cortex and the subiculum. Note that only a single independent datum point was available for the MEnt, LEnt and VS under shielded magnetic field conditions (ShMF) (cf. §2.4.). See caption of figure 3 for explanation. Closed asterisks indicate comparison with a control group of animals exposed to the local geomagnetic field, open asterisks comparison with another experimental group. (a) Medial entorhinal cortex (MEnt); (b) lateral entorhinal cortex (LEnt); (c) dorsal subiculum (DS); (d) ventral subiculum (VS).
Marked differences in c-Fos expression between animals subjected to different magnetic fields were detected in the hippocampus of both caged and arena-exploring animals (figures 6 and 7; table 1). In the caged animals, a significant effect was seen in the PoDG (F2,7 = 8.5; p < 0.05), CA3 (F2,7 = 5.4; p < 0.05) and CA1 (F2,7 = 7.4; p < 0.05). The exposure to the field repeatedly manipulated in intensity resulted in the induction of the expression in the PoDG and in the suppression of the expression in CA3 and CA1 (figures 6b-d and 7). The exposure to the field, the polarity of which was repeatedly inverted, caused suppression of the expression in CA3 (figure 6c). In the arena animals, a significant effect was seen in all subregions analysed: the granular layer of the dentate gyrus (F3,8 = 9.6; p < 0.01) and PoDG (F3,8 = 8.6; p < 0.01), CA3 (F3,8 = 4.3; p < 0.05) and CA1 (F3,8 = 9.1; p < 0.01). Animals exposed to the field that was repeatedly shifted in azimuth exhibited diminished c-Fos expression in the granular layer of the dentate gyrus and PoDG and the CA1 (figures 6a,b,d and 7). Nest building in the shielded magnetic field resulted in the suppression of the expression in all hippocampal regions but not in the CA1 (figures 6 and 7).
Less prominent effects of magnetic field properties were observed in the entorhinal cortex and the subiculum (figure 8; table 1). In the arena animals, significant differences were observed in the medial (F2,7 = 4.9; p < 0.05) and lateral (F2,7 = 4.8; p < 0.05) entorhinal cortices. The exposure to the field repeatedly shifted in azimuth resulted in a significant c-Fos suppression in both regions (figure 8a,b). In the caged animals, the effect was only observed in the dorsal subiculum (F2,7=9.3; p < 0.05), with diminished expression in animals exposed to the field manipulated in intensity (figure 8c). Neither novelty (exploratory) response nor magnetic field effect was detected in the ventral subiculum (figure 8d).
3.4. c-Fos expression in the striatum and the primary motor and somatosensory cortices
In the caged animals, the striatum displayed extremely low, and the primary motor and somatosensory cortices moderate, c-Fos expression; no magnetic field effect on the expression was observed (figure 9; table 1). Mole-rats nesting in the arena showed higher c-Fos expression relative to the caged animals in the striatum (F1,6 = 28.6; p < 0.01) and the primary motor cortex (F1,6 = 6.8; p < 0.05), no significant difference was observed in the primary somatosensory cortex (F1,6 = 2.0; p > 0.2). In the arena animals, the only effect of magnetic field properties was seen in the primary somatosensory cortex (F3,8 = 4.2; p < 0.05), with increased c-Fos expression in animals exploring the arena in the shielded magnetic field (figure 9c).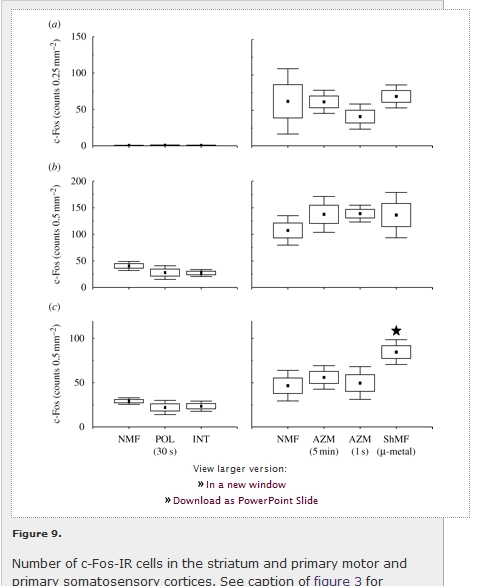
View larger version: Figure 9. Number of c-Fos-IR cells in the striatum and primary motor and primary somatosensory cortices. See caption of figure 3 for explanation. Closed asterisks indicate comparison with a control group of animals exposed to the local geomagnetic field. (a) Caudate putamen (striatum) (CPu); (b) primary motor cortex (M1); (c) primary somatosensory cortex (S1).
Previous SectionNext Section
4. Discussion
The present experiments demonstrate that the exploration of a novel environment and/or the nesting behaviour induces c-Fos expression throughout Ansell's mole-rat navigation circuit and that this induction is suppressed by exposure to periodically changing and/or shielded magnetic fields. Moreover, in animals inactive in the familiar environment, magnetic field intensity manipulation suppresses c-Fos expression in the hippocampus proper and the dorsal subiculum and induces its expression in the PoDG. The selectivity of these c-Fos alterations is highlighted by the lack of an apparent behavioural response and the lack of any consistent change in the striatum and the primary motor cortex, implying that changing and shielded magnetic fields had no effect on the mole-rat's locomotor activity. Therefore, the observed complex modulation of the activity within the circuit can likely be attributed to a direct effect of magnetic field conditions on the spatial representation system. These findings raise the intriguing possibility that the input from the magnetosensory system contributes to the internal representation of space in Ansell's mole-rat. However, it is unclear both by what specific means the magnetic input influences the information processing within the system, and how magnetic signals reach the navigation circuit. Clearly, much more anatomical and physiological research is warranted to resolve these issues.The low to moderate levels of c-Fos expression detected in the caged animals are generally in accordance with the basal expression reported in rat-a weak expression in subcortical centres and moderate expression in the entorhinal complex and the subiculum (for review, see Herdegen & Leah 1998). However, the CA3 and CA1 hippocampal fields exhibited higher c-Fos expression than the basal expression (e.g. Hughes et al. 1992; Herdegen et al. 1995). This may be due to social interactions between the animals since they have been housed in sibling pairs/groups during the experiments. Likewise, the elevated levels of c-Fos in the arena animals are in line with exploration-induced c-Fos expression that has also been reported in other rodents. For instance, rats exploring a novel environment display enhanced expression of c-Fos in cortical and subcortical sensory centres, CA1 and CA3, the anterior thalamic nuclei and many cortical regions including entorhinal, presubicular and retrosplenial cortices (Handa et al. 1993; Hess et al. 1995; Montero 1997; Wirtshafter 2005). c-Fos is also induced in the hippocampus after behavioural experience in a radial arm maze (Vann et al. 2000; Colombo et al. 2003) or in a water maze (Guzowski et al. 2001). Because of relatively high c-Fos expression in the caged animals (see above), we observed rather weak and no effect of exploration in the CA3 and CA1, respectively.
The fact that exploration and/or nesting-induced c-Fos expression is suppressed by exposure to both protean and shielded magnetic fields appears less trivial. Because mole-rats use a polarity compass for orientation (Marhold et al. 1997b), one would expect that the change of field azimuth stimulates brain regions involved in the perceiving and processing of magnetic information. We therefore expected increases in c-Fos expression within the navigation circuit in animals exposed to the fields that were repeatedly shifted in azimuth. By contrast, one would intuitively expect a lower activity in the absence of magnetic cues, i.e. in the shielded magnetic field. How do we explain the observed universal trend towards a suppression of c-Fos expression after exposure to the manipulated fields? In the natural magnetic field, mole-rats exploring an unfamiliar arena rely primarily on motion cues (i.e. path integration), cues derived from geometric boundaries of the arena (see Avni et al. 2008) and magnetic cues. Ansell's mole-rats are poorly equipped for orientation in the three-dimensional visual environment that is encountered by a rodent active above-ground (Němec et al. 2004, 2008). Thus, the magnetic field azimuth seems to be the only available external directional reference which is decisive for the nest and food cache positioning. In turn, the nest is used as a self-built home base for further exploration of the local space. In the ambient magnetic field-shielded environment, mole-rats experience a lack of perceptible magnetic orientation cues. In the magnetic field that was shifted periodically in azimuth, magnetic directional cues are perceptible but extremely unreliable; mole-rats experience a severe conflict between the only distant allothetic cue (i.e. the magnetic field azimuth) and idiothetic cues. In addition, the periodically changing azimuth is in conflict with all putative intramaze cues such as the nest, food cache or scent marks. In the absence of reliable external reference information, the path integration is subject to a cumulative error (e.g. Etiene et al. 1988; Benhamou et al. 1990; Stuchlik et al. 2001). This error may produce a mismatch between the animal's expectation and the real perception, which not only compromises spatial processing within the navigation circuit but may also affect spatial and contextual learning in the hippocampal system by decreasing the likelihood of an event being consolidated in memory. Given the presumed role of immediate early genes in memory consolidation and the long-term potentiation maintenance (Fleischmann et al. 2003; Miyashita et al. 2008), this decrease may occur via downregulating activity-induced gene expression including c-Fos despite uninhibited cell activity (see Quirk et al. 1990). Indeed, c-Fos imaging studies demonstrated that the efficiency of the c-Fos induction in spatial tasks in which orientation cues (distal visual landmarks) were manipulated in rats largely depends on the experimental design (for review, see Kubik et al. 2007). Notably, the spatial rearrangement of the visual cue cards induced c-Fos in the hippocampus (Jenkins et al. 2004), whereas their temporal rearrangement suppressed c-Fos expression in the hippocampus and the retrosplenial cortex (Amin et al. 2006). The link between the magnetic field information and the head direction system might be more direct. The absence of reliable azimuth cues, which would allow for correcting the cumulative error in the angular path integration, may have a detrimental effect on the head direction system. For instance, a drift of the preferred firing direction of the head direction cells was reported in the rat after the removal of the familiar visual cues or turning off the lights (Taube et al. 1990; Mizumori & Williams 1993; Goodridge et al. 1998). Moreover, animals exposed to a magnetic field manipulated in azimuth experience a serious discrepancy between signals from the vestibular and the magnetosensory systems.
The significant effect of the magnetic field intensity manipulation in the caged animals is even more surprising. This finding suggests that mole-rats have a capacity to perceive subtle changes in the field intensity (approx. 2% of the total field). Sensitivity to the field intensity may theoretically be an inherent property of the magnetite-based magnetoreceptor (e.g. Shcherbakov & Winklhofer 1999; Davila et al. 2003; Fleissner et al. 2007). Alternatively, the magnetic field intensity might provide positional information because it varies across the Earth's surface on both a global (gradients from poles to the equator) and local scale (local field anomalies). Indeed, there is a growing body of evidence that diverse animal species use magnetic positional information for orientation over a wide range of spatial scales (for review, see Freake et al. 2006; Lohmann et al. 2007). However, this putative magnetic map sense has not been demonstrated in mammals so far and is not expected to be present in non-migratory animals that possess a small home range and a limited dispersal capacity. Notably, we observed the significant effect of intensity manipulation exclusively in brain regions harbouring the place cells. Hence, it is tempting to conclude that mole-rats learn the local magnetic topography and use it for navigation within their territories. But this inference is premature. For instance, it seems possible that the intensity changes activate putative inhibitory interneurons in the PoDG, which, in turn, suppress sequential information flow from the dentate gyrus to the CA3, then to the CA1 and the subiculum. Consequently, it remains unclear whether Ansell's mole-rats exploit magnetic positional information.
To the best of our knowledge, the present results constitute the first evidence that the activity within the rodent navigation circuit can be influenced by low-intensity (less than or equal to 50 µT) static magnetic fields. However, previous studies have demonstrated that acute in vivo exposure to a high-intensity (0.14 T) static magnetic field (Kristofikova et al. 2005) and to 60 MHz magnetic fields (Lai et al. 1993; Lai & Carino 1999) decrease cholinergic activity in the rat hippocampus. This magnetic field-induced diminution in sodium-dependent high-affinity choline uptake caused performance deficits in a radial-arm maze (Lai 1996). Besides, recent evidence shows that cholinergic blockade (pretreatment with antimuscarinic drugs, scopolamine or atropine) greatly suppresses novelty-induced c-Fos expression in the hippocampus and retrosplenial cortex (Wirtshafter 2005). In this context, one might hypothesize that the suppression of the exploration-induced c-Fos expression observed in the present study has nothing to do with spatial processing and is a by-product of the magnetic field effect on the cholinergic system. However, if magnetic fields exert control over the c-Fos expression solely via the cholinergic system, c-Fos expression should also be suppressed in the neocortex. At least in the primary somatosensory and primary motor cortices, this is clearly not the case. So, this hypothesis is not tenable.
The adaptive significance of magnetic orientation in the underground ecotope is obvious (Moritz et al. 2007). In a monotonous, dark world deprived of most sensory cues available above-ground, the Earth's magnetic field provides an omnipresent and reliable source of directional, and perhaps also positional, information. Magnetic cues enable subterranean dwellers to keep the course when digging long foraging and dispersing tunnels, to avoid unnecessary digging in maintaining their burrows (interconnecting of damaged tunnels, effective bypassing of obstacles), to find their way back home after rare surface activities (e.g. mate-seeking excursions, exceptional foraging above-ground) and possibly to construct map-like representation of their territory. Hence, it may not be surprising that magnetic orientation was demonstrated in two phylogenetically distinct families of subterranean rodents: the African mole-rats (Bathyergidae) and the Eurasian blind mole-rats (Spalacidae) (see §1). However, recent studies have yielded evidence that magnetic sensitivity is more widespread in mammals. Magnetic compass orientation has been reported in epigeic rodents (Deutschlander et al. 2003; Muheim et al. 2006) and bats (Holland et al. 2006; Wang et al. 2007), and magnetic alignment in ruminants (Begall et al. 2008; Burda et al. 2009). Thus, magnetic directional cues are used for short- or long-distance orientation also in surface-dwelling mammals, although probably only in specific behavioural contexts and/or specific environmental conditions. For instance, a robust magnetic compass was demonstrated in the Siberian hamsters, Phodopus sungorus, and inbred C57BL/6J mice in a visually symmetrical arena after learned association of the magnetic field azimuth with a light gradient (Deutschlander et al. 2003; Muheim et al. 2006). In any case, the wide taxonomic distribution of the magnetic orientation suggests that the processing of magnetic information within the navigation circuit may not be limited to specialized species such as mole-rats.
Previous SectionNext Section
5. Conclusion
The results of the present study suggest that both the head direction system and the entorhinal-hippocampal spatial representation system of Ansell's mole-rat contain populations of neurons that are responsive to magnetic stimuli. We therefore hypothesize that orientation cues derived from the Earth's magnetic field are integrated with information from other sensory and motor systems into a common spatial representation of allocentric space within the navigation circuit. However, the specific mechanisms underlying this integration have yet to be identified and characterized. It will be most interesting to learn whether the magnetic cues exert any influence on the directional and/or positional firing patterns of the head direction, place and grid cells. Another challenge for the future is to determine whether similar neural processes constitute the basis of magnetic compass orientation also in other mammals.Previous SectionNext Section
Acknowledgements
The animal husbandry and all of the experimental procedures complied with the European Community regulations on the care and use of experimental animals and were approved by the institutional animal care and use committee of the J.-W. Goethe University in Frankfurt am Main.We cordially thank Clemens Poth for his assistance during the experimental stage of this study, Hervé Cadiou, Martin Převorovský, Petr Telenský and four anonymous reviewers for commenting on the manuscript. Our work was supported by the Czech Science Foundation (206/06/1469 & 206/09/1364; to P.N.) and the Ministry of Education, Youth and Sport of the Czech Republic (0021620828; to P.N.).
Previous SectionNext Section
Footnotes
- ↵† These authors contributed equally to this work.
- Received December 17, 2009.
- Accepted February 19, 2010.
- © 2010 The Royal Society